
Mack’s Mid-Morning ES Chart 02-06-2026
- Home / Non Member Articles (Free) / Mack’s Mid-Morning ES Chart 02-06-2026
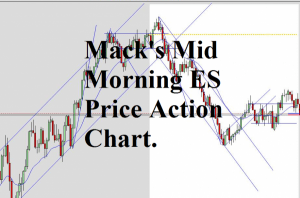

As you might expect, prices did reverse on the oversold conditions from the daily chart. The rally has been rather large so far this morning, and there is a large overhead gap on the chart. Should prices turn down at some point and start trending lower, filling that gap could be a target. If so, that price level is down at 6788.75.
While the overall bias is still up for now, that could be changing as I am typing this up. Things have gone sideways and mostly mixed since about 9:00 AM CST. Many times, a new flatter trend will re-emerge, so watch for further movement to the upside, but do not rule out continued sideways action or even a reversal to fill the gap that was left on this morning’s chart.