
Finding And Recognizing Strong Support and Resistance When Trading Price action
- Home / Non Member Articles (Free) / Finding And Recognizing Strong Support and Resistance When Trading Price action
Today we are going to talk about the importance of finding and recognizing strong support and Resistance when trading price action. While its true that most traders have some understanding of support and resistance levels, most do not really understand just how important support and resistance is to their day trading success. Almost every thing happens around strong or emotional support and resistance levels. Notice that we added the word “emotional” to support and resistance as well, and this is because most of the strongest support and resistance levels are indeed emotionally driven by the minds of all of the traders combined. There is a link there to another article about using support and resistance that compliments this information as well, so be sure to read it too!

The reason support and resistance is so important is that it’s the key to day trading success, and these support and resistance areas are where the majority of the magic happens. All the market really does each day is seek out and test support and resistance. If prices test a particular support or resistance area a few times and it holds, prices will reverse and start testing areas in the opposite direction until it fails to go any further and then the process will reverse again. Until prices find strong support or resistance, they will usually continue to trend in one direction. There will actually be areas where prices stall or struggle to work through due to the number of buy or sell orders that are found at that level, but until prices can break through those areas and stay on the opposite side, it’s still an important level. In fact, even if prices do trade through support or resistance, it will usually be tested from the opposite side multiple times as well.
Every successful trader is keenly aware of support and resistance and they certainly understand why they must be aware of these areas, and if they are profitable, it’s very likely that they understand that these areas are where most of your best trades are going to materialize. Even inexperienced traders normally can find and spot the horizontal support and resistance points, but what they don’t truly understand is that trend lines are nothing more than angled support and resistance that have just as much, and often even more, importance than their horizontal counterparts. The best and most profitable traders know and understand the importance of these trend lines, and they also get the fact that the best trades are setting up in these areas during pullbacks to them. If you didn’t already understand that proven trend lines are simply angled support and resistance areas, you should now!
Just in case you think we are the only ones that think support and resistance is important to day trading, you should understand that there are websites that are dedicated to nothing more than teaching day traders about support and resistance. Below is an actual excerpt we took from www.rightline.net that talks about the importance of support and resistance. Here is what that article had to say.
[stextbox id=”download” caption=”Quote” collapsing=”false” collapsed=”false” mode=”js” image=”null”]
In almost every issue of the RightLine Report we refer to support and resistance levels. Indeed, many of our stock entry points are based on potential price reactions to these important junctions. So just what are support and resistance levels, and why are they so important?
In the book “Trading For A Living,” Dr. Alex Elder gives a simple, but effective image of support and resistance – “A ball hits the floor and bounces. It drops after it hits the ceiling. Support and resistance is like a floor and a ceiling, with prices sandwiched between them.” When a stock’s price has fallen to a level where demand at that price increases and buyers begin to buy, this creates a “floor” or support level. When a stock’s price rises to a level where demand decreases and owners begin to sell to lock in their profits, this creates the “ceiling” or resistance level.
Why? Because investors and traders are people and they have memories! Those that follow a particular stock just “know” that it “never (or rarely) falls below xx” and it “never rises above yy”. The “floor” and the “ceiling” are not fixed barriers you can touch; rather they are psychological barriers. These psychological barriers are built when traders who bought the stock at the “ceiling” are grateful to be able to get out of their positions and just break even. They were beating themselves over the head from the day they bought it, swearing they will never be so “stupid” again, and praying that they can just get out without losing their shirts. You can read the entire original article here.
[/stextbox]
While we think it’s important that you learn price action trading and learn how to read a price chart, we also think you should read and learn as much as you can about support and resistance, because it’s really a key factor to learning how to read a chart properly. Be careful about anything at these sites that falls outside of support and resistance information though, because many will want to push indicators and special systems on you that are marketed with the idea that they will help you to find important support and resistance. If you can’t learn to spot support and resistance with a quick glance at a chart, then you have no business trading live with real money anyway, so don’t fall for any gimmicky sales pitches when you do your research on this important piece of learning to day trade profitably.
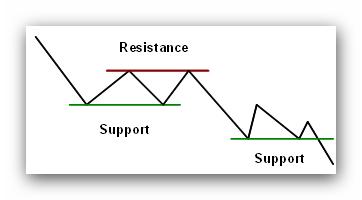
The horizontal support and resistance is usually the easiest areas to find, and it’s really any area that continues to turn prices when that area is reached. The angled areas or trend lines are a little harder to spot, but if you can draw a trend line and find one that turns prices consistently then you have likely found another strong support and resistance area that is simply angled. Learn to find these trend lines and then look to enter with the trend during pullbacks to them, and then you have found the true holy grail of trading, and no indicator or system can do this nearly as well as you can do it manually using nothing more than your eyes and then drawing the lines across the areas that you can spot for better visual cues. It’s amazing how these support and resistance areas can stick out when you actually draw the lines, versus trying to spot them without the lines.
You should now realize the importance of finding and recognizing strong support and resistance when trading price action, so get to studying and reading everything you can on this subject. As you learn more, put that knowledge to work on the simulator and get real time experience with it. If you are interested in learning how we use pure price action to trade profitably in any market, then you will want to see the information on Mack’s Price Action Trading Manual at http://priceactiontradingsystem.com/pats-price-action-trading-manual. I have attached a video below that goes into a few details about finding support and resistance areas, so be sure to watch it as well.
This site uses Akismet to reduce spam. Learn how your comment data is processed.
Comments
Lisah August 25, 2014 at
great reminder of support and resistance