
How We Use An EMA In Our Price Action Trading Strategies
- Home / Non Member Articles (Free) / How We Use An EMA In Our Price Action Trading Strategies
The article is going to discuss how we use an EMA in our price action trading strategies. When using price action strategies, our objective is to follow prices as they print to our trading chart and then to enter trades based on what the price action is telling us, versus what some indicator or other trading system might suggest. Because most people assume price action to be the use of no indicators, some people get confused when the find out we actually do keep a single 21 bar EMA on our chart.

So, how do we use this EMA and how does it work into our price action strategies? First, let’s make it clear that we don’t actually enter our trades based on anything that that EMA tells us. We are still using price action to tell us when and where to enter our trades. The only EMA we use is a 21 bar EMA, and the reason we use a 21 bar EMA is because time and experience have shown us that it is very reliable in the way we use it with our price action trading strategies.
What we have found is when the market is trending, 90% of all corrections will reverse very near the 21 bar EMA. Based on this observation, if and when we see a price action set up that forms near the 21 bar EMA, we know that the odds are on our side if we enter back with the trend on that set up. What we suggest is that you do not take our word on this, but rather go study some charts, particularly some of the ES charts, which is our market of choice when day trading futures.
What you will quickly find is that when the ES is trending, most of the corrections will find support or resistance at the EMA and set up a nice reversal pattern very near that moving average. Again, we don’t want to enter blindly at the EMA just because the pattern works consistently. What we want to do is wait for the price action to tell us when it is reversing, but when and if we get this signal near the 21 bar EMA in a trending market, we know the odds are extremely high that we will have a winning trade in most cases.
If you begin to study your charts using a 21 bar EMA, what you will find is that the EMA is very similar to a moving trend line. In other words, every time prices pull back to this moving average, it acts much like a trend line giving you support in an uptrend and resistance in a down trend. Like all trends, prices will eventually break through the EMA and a trend reversal will take place. However, we have some special rules in place that we use with our price action trading strategies that often alert you as to when you can expect a trend reversal.
Below is some additional information that we found on using an EMA in your trading. This information was posted a www.babypips.com. Just understand that we are not promoting their trading techniques, but simply liked their article when it comes to describing moving averages. The price action is the most important piece, and the moving average is only a tool that can alert you to the locations where it is highly probable that a reversal will take place on any correction in a trending market.
By now, you’re probably asking yourself, which is better? The simple or the exponential moving average?
First, let’s start with the exponential moving average. When you want a moving average that will respond to the price action rather quickly, then a short period EMA is the best way to go.
These can help you catch trends very early (more on this later), which will result in higher profit. In fact, the earlier you catch a trend, the longer you can ride it and rake in those profits (boo yeah!).
The downside to using the exponential moving average is that you might get faked out during consolidation periods (oh no!).
Because the moving average responds so quickly to the price, you might think a trend is forming when it could just be a price spike. This would be a case of the indicator being too fast for your own good.
With a simple moving average, the opposite is true. When you want a moving average that is smoother and slower to respond to price action, then a longer period SMA is the best way to go.
This would work well when looking at longer time frames, as it could give you an idea of the overall trend.
Although it is slow to respond to the price action, it could possibly save you from many fake outs. The downside is that it might delay you too long, and you might miss out on a good entry price or the trade altogether. You can read the entire original article here.
The most important thing that you should remember is that we do not suggest that you trade bounces off of the EMA blindly. It’s important that you incorporate all of our price action trading strategies into the equation to help ensure that you are using these strategies properly. We have been trading for many years and we have watched thousands of hours of price action form in front of us on a trading chart, so that alone has given us a keen eye on spotting these reversal points. When you combine our ability to also read the price action, it really gives us an edge in our trading.
Some of our top trading patterns are based on how price action forms around the EMA during pullbacks in a trending market. If you would like to learn some of these techniques, you can spend some time exploring our website and watching our daily chart lessons that are always free. We also suggest that you consider adding our price action trading manual to your arsenal so that you completely understand our techniques and so that you do not miss any of the most important details. We hope our information on how we use an EMA in our price action trading strategies has been helpful and that you can use it in your trading to help improve your winning percentages! To learn more about our price action strategies, you can go to http://priceactiontradingsystem.com/pats-price-action-trading-manual/.
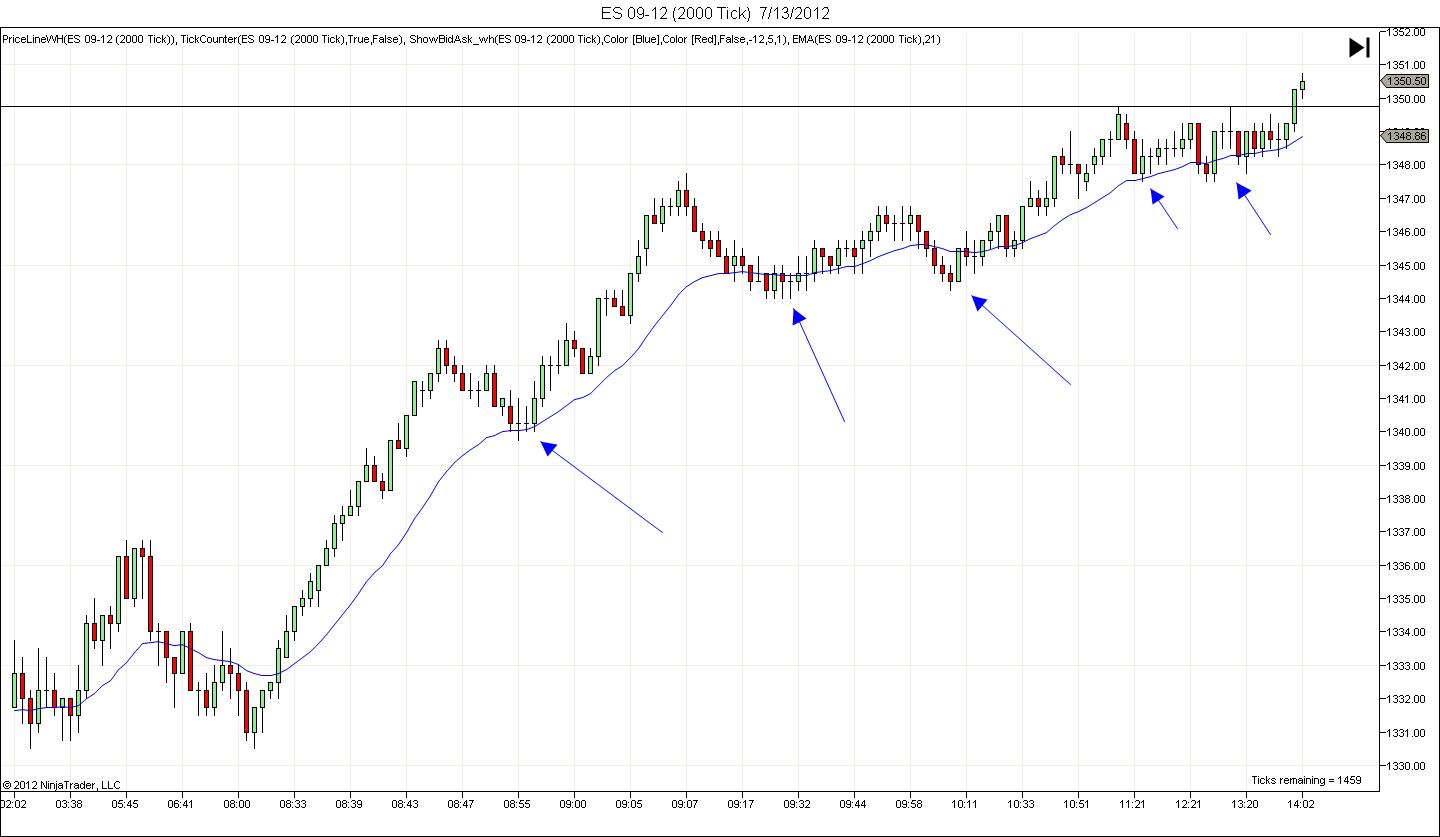
Below is a trade example of how we use the EMA to find price action trading strategies.
This site uses Akismet to reduce spam. Learn how your comment data is processed.
Comments
joe August 4, 2013 at
Hello. What time frame are you looking at with regards to the 21 ema. Joe
Mack August 5, 2013 at
Joe, we use a 21 bar EMA no matter the time frame. 5 min or daily, we still use a 21 bar EMA.