
What Time Frame Works Best For Trading Price Action Strategies
- Home / Non Member Articles (Free) / What Time Frame Works Best For Trading Price Action Strategies
When it comes to our price action trading strategies here at PATs, one of the questions I get more than any are about chart time frames. People want to know what time frames are best for price action trading and they want to know what time frame works best for trading price action strategies. The truth is, price action works on any time frame, so it doesn’t matter what your choice of chart might be, as it works exactly the same on any chart.

Pick any 3 or 4 charts you like of different time frames. Start with a 3 minute chart, then go to a 3 hour chart and finally pick a weekly chart. What you will find is that once you print off those three charts and you remove the labels from them, that you won’t be able to tell one chart from the other. If I did this exercise for you and then handed you the three charts, I would be willing to bet you could not identify which chart matched what time frame. They would all look similar, and if you studied them, you would find that you can read the price action on all of them equally.
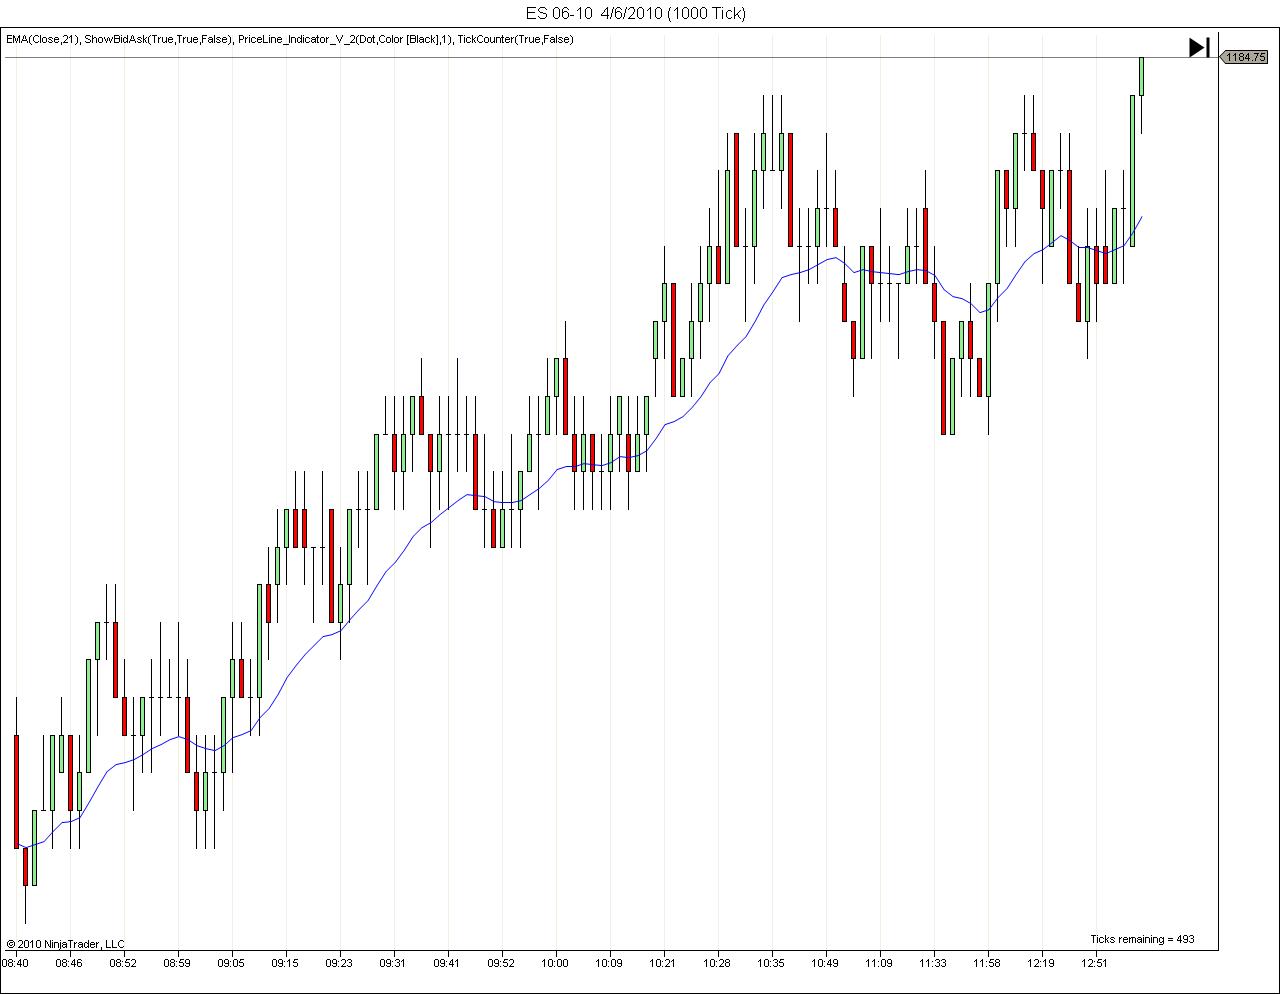
Another important point that we always make sure people understand is that we prefer to trade tick or volume charts over time charts, and in that order too. Tick charts, volume and then time is how we rank our chart types. What size tick chart varies, but if we are day trading, we prefer to find a tick chart that looks as visually close as possible to a 5 minute chart. Why don’t we just use a 5 minute chart you ask? The reason is because we can see more details in the price action by following tick charts or volume charts, so that’s why we prefer those charts over time charts.
Once you determine your preferred type of chart, the chart size or time frame then becomes more of a preference than anything else. We believe that trading a chart any smaller than 5 minutes makes it very difficult to read the price action quickly enough to make really good decisions, so we normally recommend that you do not trade a chart any smaller than 5 minutes. We found a great article that talks about chart size preference and we thought that the information would go well with this post. Here is what Doug Tucker had to say about chart sizes and time frames at www.tuckerreport.com.
Choosing the correct time frame for your style of trading is an important step in creating a workable trading plan. If the time frame is too short or too long to suit your personality, the trading plan will not survive, no matter how good the system or trading approach is. There are many things to consider before deciding on which time frame is best suited to your personality and goals.
The longer-term position trader has a much simpler task of finding the ideal time frame. Unless the longer-term trader has online data and is sitting in front of the computer watching prices, the choice is simply the daily time frame, the weekly time frame, or the monthly time frame.
The daily time frame is by far the most commonly used, and that is the problem with it. Since so many traders use it, they all know where the daily swing or inflection points are. It is easy to run stops in those areas. This is most likely the reason breakout systems don’t perform as well as they used to. And, daily time frame traders mostly get trading signals on their indicators and oscillators at roughly the time. The daily time frame is extremely crowded. When everyone is looking at the same thing it is difficult to gain an edge. It is best to get out of the crowd, and go to either a shorter time frame, or a longer time frame. The choice of a shorter time frame would mean an intraday chart, such as a 60 or 30 minute. This is not practical for traders with other activities requiring their attention during market hours, or for very large traders who can’t move in and out of markets quickly. Going the other direction to a weekly time frame seems to be a practical solution to get out of the noise of the crowd, allowing the trader to see the longer-term picture more clearly. Often when the daily chart appears as unpredictable noise, you can find clear trends on the weekly chart. This blog mainly uses daily charts for the daily commentary. It would be difficult to update the blog with intraday charts and still do my own trading. You can read the rest of the original article here.
The writer goes on to talk about both tick and volume charts and he seems to think they offer some advantages that are bit different than the reason we think they give us an advantage, but then we are price action traders, so that’s to be expected. When trading price action, we aren’t relying on indicators that will lead us astray. We are reading prices as they print directly to the chart, and by doing so, we have a distinct advantage over 90% of all traders in our opinion.
The most important factors of the size chart you choose, particularly if you plan to learn to use price action trading strategies, is to learn to use tick charts. Secondly, start with a tick chart that closely resembles a 5 minute chart at a bare minimum, and then work higher from there based on your personal preference. Remember, the larger the tick size you choose, the more time you have to read the price action, so it really helps for some traders to pick higher tick counts and then learn to work downwards to a lower size once you get better at reading the price action. Just remember that even we don’t trade charts smaller than five minutes, as they just become too fast to read properly.
Lastly, we like to clarify that we are not looking for a lot of trades either. We prefer quality trades over the quantity of trades, and most new traders don’t get this at all. They are constantly looking for a reason to enter the market at any place, when they should be waiting for what we call “key entry points” while reducing their overall number of entries. If you want or need to make more money, don’t take more trades. Just take the best trades and add more contracts or shares. In the end, you will be a better trader and you will likely have a much bigger trading account. We hope you now have a better understanding of what time frame works best for trading price action strategies. If you would like to learn to trade price action, you can check out our price action trading manual at http://priceactiontradingsystem.com/pats-price-action-trading-manual/.
This site uses Akismet to reduce spam. Learn how your comment data is processed.
Comments
steve February 9, 2021 at
So how about giving the tick size for ES and MES that works well?
Mack February 9, 2021 at
950 for MES and 2000 for ES.