
Price Action Offers A More Consistent Way To Determine Trade Entry Locations
- Home / Non Member Articles (Free) / Price Action Offers A More Consistent Way To Determine Trade Entry Locations
I am often asked if trading with price action offers a more consistent way to determine trade entry locations, and the answer is an astounding yes! Our number one rule in price action trading is to never counter trend trade. Most traders lose money because they are always trading against the prevailing trend. There are actually some days where fading strong moves is wise, but most traders do not understand why this is the case, and most traders do not even understand what is going on when prices are printing to their chart, so they never really understand the type of trading day they are witnessing, much less how to properly enter trades based on the current trading day.
Listen closely and read this as many times as necessary, because what I am about to tell you is the key to learning to trade profitably. Your first goal each trading day is to determine the type of trading day that is occurring and then trade accordingly, understanding that the trend always takes precedence. If you can truly learn to understand what I just said and act accordingly, you can improve your trading immensely.
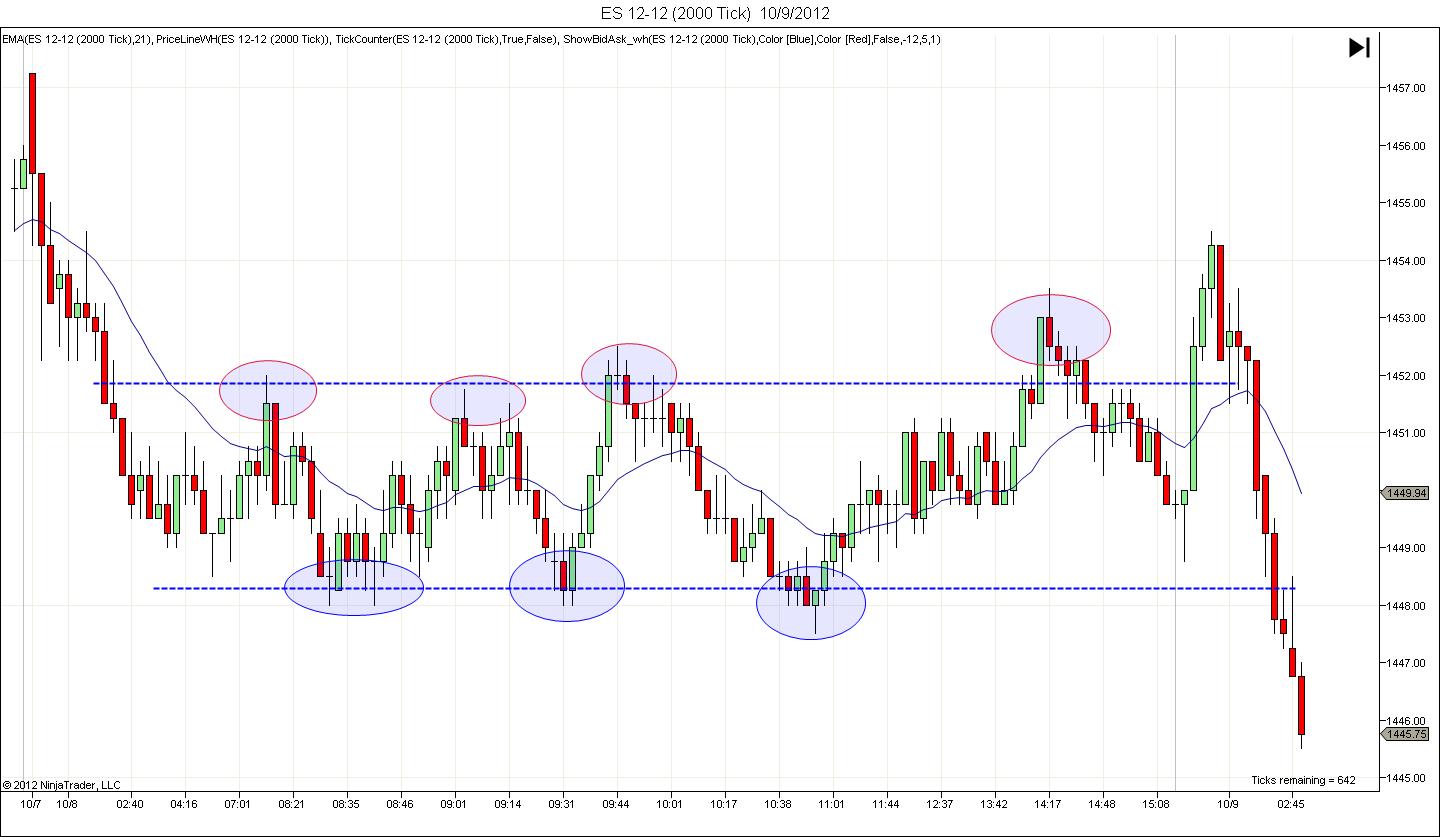
There are generally two types of trading days, although you can get a combination of both days on occasion. Just remember this first and foremost: Your first goal each day should be to determine the type of day. You must determine if prices are ranging or trending? Below is a chart that depicts a range day in the ES, which will happen more than any other type of day. On range days, you can use two sided trading without worrying about counter trend trading really. Notice where the best entries are located. Shorts are noted in red and buys are noted in blue. Looks pretty easy right? It is, but it takes discipline to buy those lows and sell those highs, and most traders will do just the opposite and get trapped on the wrong side each time.

If prices are ranging, you want to look for long entries at support and short entries at resistance. On these days, fading strong moves into support and resistance will offer you the best entries, so these could be looked at as counter trend trades almost, because you will usually want to fade (take an entry in the opposite direction) the strong moves that often break through support and resistance, but then fail and quickly move back in the opposite direction. The bottom line is that if you see a range day, trade using your range day entries as I just discussed.
Now take a look at a trend day in the ES. On trend days, you only want to enter with the trend on pullbacks to the trend line. It’s important that you learn how to find the trend line, and if you get it right, you can normally copy that line and drag it to the other side of the price action and then find a channel that the trend is following. While there are a few counter trend trades that would offer a profit on trend days, most would end in a loss and they are all far to risky to attempt. By entering with the trend during pullbacks to the trend line, you can make easy money all day long! Notice the two blue circles in the down trend below though. Those were the two times prices actually tested the lower trend channel line. That’s where you should expect the best corrections to begin, so they are usually a good place to take profits. See the downward trending chart below.

So, learn to trade only with the trend on trend days, entering on pullbacks to the trend line and you will improve your trading and become a much more consistent trader. While I used a down trend in this example, if the trend is up, simply find the proper trend on the way up and then buy pullbacks to the trend line on the way up. Do not counter trend trade for any reason on trend days, particularly when they are strong trend days like the example above.
I actually picked two very easy to distinguish days here, and it’s not always this easy to find the trend channel and it’s also not always so easy to find the range, although it’s almost always there if you work hard enough at finding it. Over time, you will get better at it too, but I suggest you always draw your lines on your chart, as that makes it much easier to see what’s going on. It’s amazing how quickly a range will come into focus once you apply the support and resistance lines, when without those lines, it’s very difficult to see the range. I normally look for where prices make the most touches across the highs and lows on range days. An over shoot on a range day normally means nothing, and is simply a chance to get into the trade at a higher or lower point for a much better profit potential.
One final thought that I want to touch on again is the fact that ranges do turn into trends and trends do go into ranges, so don’t lose sight of the fact that a day can change, and that also includes trend reversals as well. Trends normally do not not reverse until you get a trend line break and then a retest of the lows in a down trend or a retest of the highs in an uptrend. Prices will normally fail out one or both sides of a range before they begin trending again, but as with anything when it comes to trading, nothing is written in stone and unexpected things can happen on any given day. If you spend some time studying charts with the information I just shared with you, I think you will easily agree that price action offers a more consistent way to determine Trade entry locations.
If you would like to learn to trade with price action and learn more about our price action trading strategies you can find more information at http://priceactiontradingsystem.com/pats-price-action-trading-manual/.