
How To Use Price Action To Trade At Support And Resistance
- Home / Non Member Articles (Free) / How To Use Price Action To Trade At Support And Resistance
Most new or inexperienced traders struggle during trading range days, and they easily fail to see what so many experienced price action traders see with little or no problems. Trading range days are actually one of my favorite days in the ES, because the price action is so predictable on those days. If you are interested in learning how to use price action to trade at support and resistance like a professional, then you should spend some time with this post, as we are going to show you what we think is one of the easiest types of days to trade, and that’s range days.

Listen to this trading story and see if it does not sound very familiar to you. Price are moving downward and you are watching them move downward, then pull back for a few bars or candles, and then move quickly lower again. After watching prices do this several times, you finally decide that you can’t watch prices go lower again without you, so as they are moving strongly lower, you join in and sell a few contracts or shares of stock, and no sooner than you have sold, prices start to stall and even slowly tick higher. It’s slow and methodical at first, but within a few minutes, prices are racing higher and you are quickly losing money.
You are asking yourself how this could be happening? Prices were just moving strongly lower, and now they are racing higher, just as you enter the market to the downside. Does this sound familiar to you? If not, just reverse the directions and see if it doesn’t now sound familiar. If you have ever traded any market, then it’s highly probable that this story has an eery familiarity to you. We know, because it has happened to us many times in the past as well. Long ago, we were at a loss and completely puzzled as to why, but now we understand price action and we know exactly why this is happening, and we also know exactly how to avoid it.
One of the main reasons this happens is because strong support and resistance tends to hold prices. The bulls are looking to buy every time prices reach certain levels on the way down, so they simply hold and look to buy only when prices reach these levels, which is exactly where the unknowing or unprofitable traders are looking to sell. On the other hand, as prices move higher, the bears are watching for strong resistance areas, and when prices reach them, they are looking to sell, while the weak hands or unknowing hands are looking to get long. It’s a vicious cycle that repeats itself over and over every day.
Once you learn to read a price chart and you learn how prices are going to react the majority of the time when they reach these important price levels, it becomes so predictable that you can understand why you never realized or understood this previously. Below is a small portion of a trading article that discusses support and resistance. Here is what the writers had to say about support and resistance at www.rightline.net.
In almost every issue of the RightLine Report we refer to support and resistance levels. Indeed, many of our stock entry points are based on potential price reactions to these important junctions. So just what are support and resistance levels, and why are they so important?
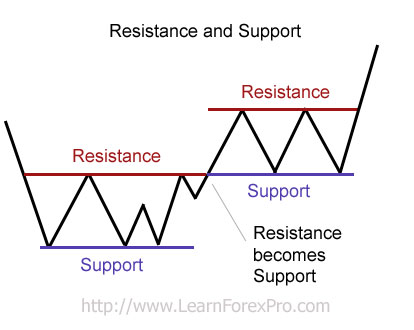
In the book “Trading For A Living,” Dr. Alex Elder gives a simple, but effective image of support and resistance – “A ball hits the floor and bounces. It drops after it hits the ceiling. Support and resistance is like a floor and a ceiling, with prices sandwiched between them.” When a stock’s price has fallen to a level where demand at that price increases and buyers begin to buy, this creates a “floor” or support level. When a stock’s price rises to a level where demand decreases and owners begin to sell to lock in their profits, this creates the “ceiling” or resistance level.
Why? Because investors and traders are people and they have memories! Those that follow a particular stock just “know” that it “never (or rarely) falls below xx” and it “never rises above yy”. The “floor” and the “ceiling” are not fixed barriers you can touch; rather they are psychological barriers. These psychological barriers are built when traders who bought the stock at the “ceiling” are grateful to be able to get out of their positions and just break even. They were beating themselves over the head from the day they bought it, swearing they will never be so “stupid” again, and praying that they can just get out without losing their shirts.
How To Recognize Support and Resistance
You can identify support and resistance levels by studying a chart. Look for a series of low points where a stock falls to this level, but then falls no further. This is a support level. When you find that a stock rises to a certain high, but no higher, you have found a resistance level. If you find yourself struggling to find the support or resistance levels, then those levels may be not be very strong.
Strength of Support or Resistance
The more times that a stock bounces off support and falls back from resistance, the stronger these support and resistance levels become. It creates a self-fulfilling prophecy. The more often it happens, the more likely it is to happen again. The more those historical patterns repeat themselves, the more traders “know,” and the more confident they become in forecasting the future behavior of the stock. Some stocks become so entrenched in this trading range, that the stock eventually has a hard time breaking through the levels to either the up or downside.
Using Support and Resistance
Long traders will often set a stop slightly below one of the support levels, and short sellers will often set their stops just above resistance. The reason for these stop levels is because investors “know” that historically; these price points are unlikely to be violated. When either of these points is exceeded to the point that stops go into effect, then there is the potential for a powerful price move as automatic buying or selling is set into motion by the stops being triggered. You can read the rest of the original article here.
While this article is talking about stocks, you can substitute any other market such as futures or Forex in place of the word stocks, because it’s all the same when it comes to the laws of price action trading. When you find a strong support and resistance area that is being tested over and over during the same trading day, that is what we describe as a trading range day, and we love those types of days, as we will simply wait on prices to reach one of these strong areas and then we are looking to buy if it’s support and sell if it’s resistance. It’s really that easy, but the key is knowing how to read the chart and fully understanding what’s likely to happen when prices do reach these levels.
Believe it or not, many traders don’t even know or recognize strong support and resistance, and if they do, they think that if prices break them, that you should enter in that direction, when in most cases, you would be best served by fading those breakthroughs, particularly when trading the ES, which is our preferred trading market. Hopefully this post has enlightened you and now you truly want to learn more about how to use price action to trade at support and resistance. If that’s the case, then continue to read and study our information and watch our price action trading videos that we do each day. If you want to learn to trade price action like a professional, you can find more information on how to do so at http://priceactiontradingsystem.com/pats-price-action-trading-manual/.