Why Candlesticks Work Best When Trading Price Action
- Home / Non Member Articles (Free) / Why Candlesticks Work Best When Trading Price Action


In this article I am going to explain to you why candlesticks work best when trading price action. Price action trading is actually a visual trading strategy, and our trades are triggered by certain visual cues as the prices print to a chart in real time. We are NOT relying on indicators or special triggers, but rater we are relying on the visual clues that prices leave as they print to a chart in real time. We are only interested in entering trades when prices reach a specific area on our chart, and even then, we are still waiting on visual cues to help us recognize when it is time to enter the trade.

If you have never traded candlesticks, then you should understand that they are a visual form of charting prices. If we are entering a short trade, in most cases we want a bearish type of bar to signal us that it’s time to enter short, and when entering long, we want a bullish signal bar to relay to us that now it’s time to enter long. It’s not simply the signal bar alone that tells us it’s time to enter, but rather the signal bar appearing at the proper location on our chart. By using the colored bars of candlesticks, we can see a bullish or bearish bar with only a cursory glance as they print to our charts, so for this reason, we like to use them in our price action trading strategies.
I realize that there is actually an entire art and trading strategy that is built around Japanese candlesticks, but we aren’t really interested in those strategies and set ups, so don’t worry about having to learn all about candlestick patterns. Just concentrate on learning how to trade with price action and the rest will come to you with experience. The real purpose of the candlesticks is basically all about the fact that they are very visual and allow you to quickly and easily see what the current bar is doing without any real effort. Dojis, which are in reality a single bar trading range, become easy to spot, and reversal bars, whether long or short stick out like a sore thumb for us, making our ability to spot important price action on our chart with only a glance.
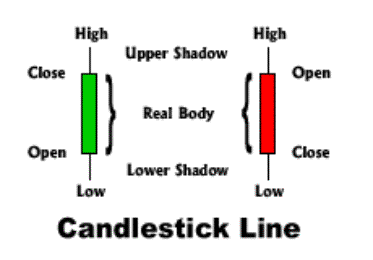
Below is an excerpt I took from another website that discusses and explains more about Japanese candlesticks. I wanted to share this page with you so that you could get a little more understanding about candlesticks. I found this information at www.traderslog.com and it had the following to say about them.
Candle Charting Basics
“A good beginning is the most important of things” (Japanese proverb)
This section discusses only a few of the scores of candle chart patterns. There are many important candle patterns and trading tactics not discussed in this basic introduction. As such, do not trade based on the limited information. The goal of this section is to illustrate how candles can open new and unique analytic doors, not to provide a trading methodology. For example, there are many times candle signals should be ignored. This is where experience with candle charts comes in.
WHAT ARE CANDLESTICKS?
Japanese candle chart analysis, so called because the lines resemble candles, have been refined by generations of use in the Far East. These charts are now used internationally by traders, investors and premier financial institutions. Candle charts:
As you can see from this small portion of the article, even this author stresses the fact that we are not so much interested in candlesticks for the reasons that they were traditionally taught to be used, but more so for the fact that they are a very visual form of charting prices. It’s the visual cues that they give and the ease at which they can be seen that makes them important to us as price action traders. If you are not well informed on our price action entry strategies, then I think it’s important that we tell you that we are not just looking for certain signals to enter, but we know and expect where these signals will form well in advance, so we are normally waiting on prices to come to us, rather than chasing prices to enter a trade.
This is only a small start to the practice of price action trading, and we don’t want to over complicate or even over simplify anything at this point, so just understand that it’s all very visual and that is why we like using candlesticks. We actually take this one step further though and also look for visual cues in the price action as each bar prints to the chart. By using the candlesticks, we get a very visual representation that is easy to spot and easy to determine by even the most inexperienced chart trader. It is much easier to spot a reversal bar when it is a candlestick than it is to spot a reversal bar in a regular bar chart. When day trading, speed and accuracy is of the essence, and it is for this reason why candlesticks work best when trading price action! If you would like to learn more about how we use candlesticks and price action to day trade, then you can find that information at http://priceactiontradingsystem.com/pats-price-action-trading-manual.