
Comparison of ES and MES Tick Charts
- Home / Non Member Articles (Free) / Comparison of ES and MES Tick Charts
Early on I did not have much interest in the Micro equity markets, as the low volume was an issue. New markets often take a while to build interest and volume, and some times they never really achieve a large following. However, I hoped all along that eventually the volume would grow enough in the MES so that we could safely trade it with the same strategies that we use in the ES.
Having the MES as a stepping stone would make a much safer and lower cost learning alternative for newer traders to use to get their feet wet in a real money trading environment without having to risk large amounts of their hard earned trading capital while learning. Just to clarify, I am not suggesting you start off trading even the MES live until you have proven you can double or triple a $5,000 to $10,000 ES simulation account first. Always prove your abilities on the simulator before going live.
Our strategy and recommendation has always been one that you must prove you can do it on a good simulator trading live data first, and you need to do this for some extended period of time. Never trade with real money until you can have success on a simulator proving out your strategy and your abilities. You should you never risk a single thin dime of real trading capital before proving yourself. Our motto is you should never be a “donator” to the markets!
Even after proving it on the simulator, there is still the shock and awe of going live with real money. Once you put your hard earned cash on the line, suddenly your head starts spinning and you begin making rookie mistakes all over again. This is natural as emotions start to bubble up when our real money is on the line. So, having the Micro ES as a cheaper alternative to ease into real money day trading is interesting and exciting, but the issue has always been volume, so I have mostly ignored the micros until lately.
With all of the recent volatility, it appears that the volume has really taken off in the MES. Many have told me they are trading it live with no issues on slippage, although I have not actually traded it live myself yet. I plan to start taking some live test trades to see for myself first hand how this market trades. My first goal was to find the right tick chart, and that is the real purpose of this post today. To show you a comparison of the charts.
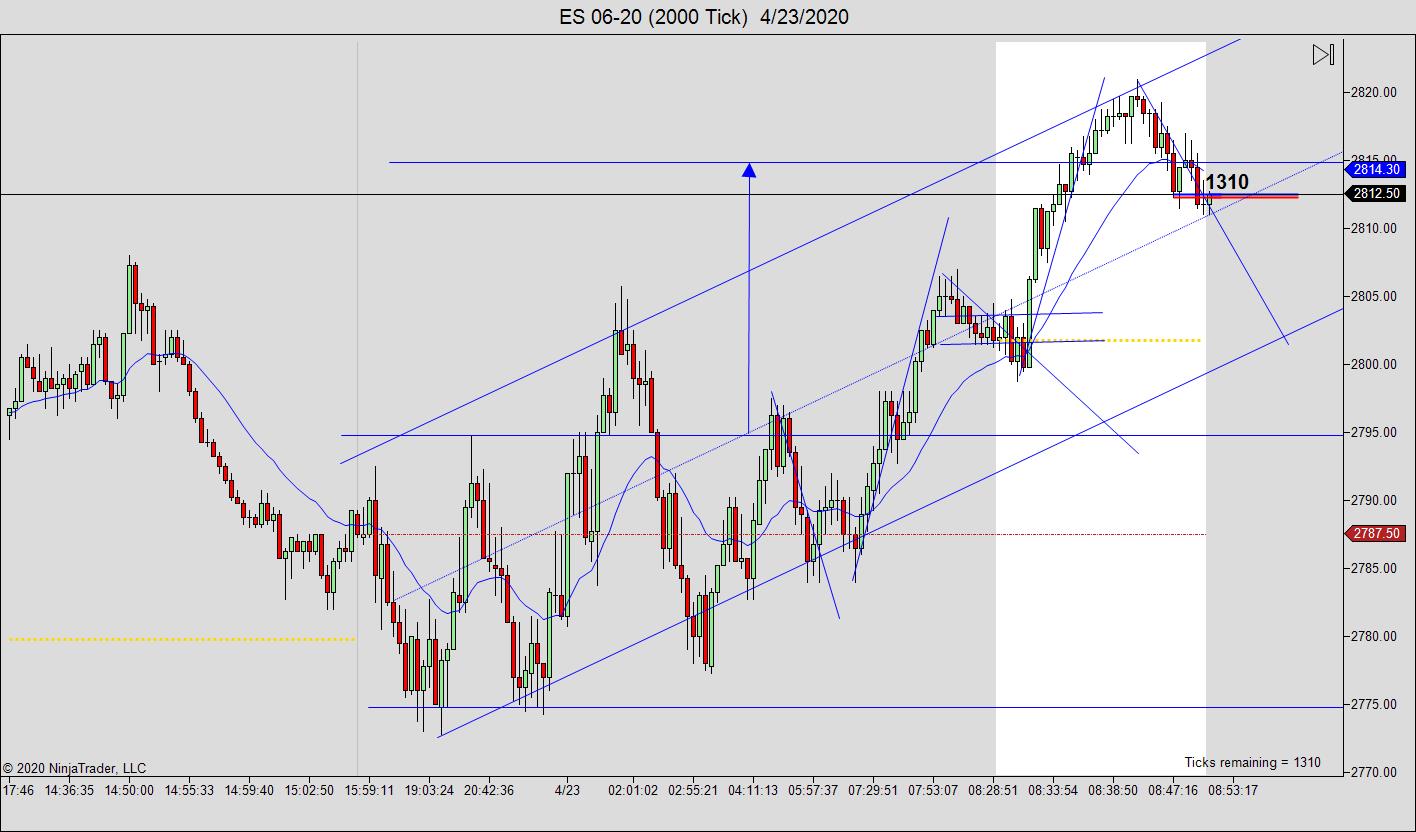
I am going to put up two charts from early morning, one a 2000 tick ES chart and the other a 950 tick MES chart, both being the June 2020 contract. Both charts are tracking very similar. The charting is slightly different so far, but that could be due to most of the price action so far is in the overnight session. I will compare them again later in the day and see how it turns out and maybe post an update, but so far, the MES looks very similar and very tradable as long as there is not issue with slippage.
Take a look at the two charts and see if you agree that they are certainly close enough that you could trade either one equally as well. I am using a 2000 tick chart for the ES and a 950 tick chart for the MES and they are both tracking along very nicely.


In conclusion, I want to trade the MES 950 tick chart for a bit to get a good feel for the slippage and fills on trades, but the feedback from some of those already trading it has been good. Most are reporting that there is no real slippage problem. As the volatility in the markets returns to normal, things may change, but for now, I think you can trade the MES using the 950 tick chart just as easily as you can the ES 2000 tick chart. Just in case people are reading this at a much later date in time and are curious about my “volatility” comments, understand I am writing this article during the CV-19 outbreak when the markets have been experiencing some of the highest volatility in my trading lifetime.
This site uses Akismet to reduce spam. Learn how your comment data is processed.
Comments
Michael K April 23, 2020 at
How did you come up with a 950 Tick chart, for MES charting? just trial and error to get it to line-up to the ES chart?
Mack April 23, 2020 at
Yes
Larry Poh April 23, 2020 at
I trade the MES…but don’t be lured into thinking it’s a lot easier; it isn’t…you have to be constantly vigilant…it does mirror the ES exactly…
Mack April 23, 2020 at
It won’t be any easier to trade, just cheaper.
Curtisg April 23, 2020 at
Mack would the EMA on the MES still be 21?
Nils April 24, 2020 at
ask yourself – why wouldn’t it?
Mack April 24, 2020 at
Yes, even if you use a daily chart or a weekly chart, use a 21 EMA.
Harry4 April 27, 2020 at
Mack, if you were going to trade the overnight session in the /ES, would you still use a 2000 tick chart?
Mack April 27, 2020 at
No, I would not recommend even trying to trade those hours. Sometimes prices do not move for hours and the volume is very thin.
Harry4 April 28, 2020 at
Ok, the reason I ask is because I’m currently residing in Thailand, and the overnight session would be ideal practice time for me, but if it is better for me to stay up late and catch the early morning session at CST, I’ll do it, if that means more reliable setups and such.
Mike F May 12, 2020 at
The MES trades very well using Macks methods. I prefer a 987 tick but have successfully backtested the MES using 740, 950, 987 and 2000 tick charts. After running a bunch of days in SIM I found the only real difference was the number of trades that setup, the quality of the setup was still there. For instance, the following was taken from a 7am – 9:30am EST average day in which the 740 tick produced 21 trades, the 950 tick produced 15 trades, the 987 produced 12 trades and the 2000 tick which produced 8 trades. Of all the above trade setups there was only 2 trades that would have been obvious losers.
Filippo Ferri December 28, 2020 at
sorry, why these particular numbers and not a round one like 1000 ticks? Is there a particular reason?
JT May 18, 2020 at
Hey Mak,
What would be the target and safety stop for this?
4 tick stop would be $8 profit and taking into account commissions it won’t be worth the move. Have you thought what the profit target and safety stop would be in your preference?
Thanks,
J
Robert June 5, 2020 at
Thanks for the info
where did the 740 come from trial and error? I know the 987 is fib
thanks
Marcus October 6, 2021 at
Is 950 tick still recommend for MES in the end of 2021? MES was founded in 2019, and I assume it’s growth has only increased since last year (thus increasing the amount of daily ticks created)
Mack October 7, 2021 at
950 is still the recommended tick count for the MES.
Gabe December 27, 2022 at
Just found this thread as someone trying to trade MES with price action that mimics ES as closely as possible.
Is 950 tick still recommended a few days from 2023?
Thanks!
Mack January 3, 2023 at
No, I would use a 2000 tick chart now, as the volume has picked up in the MES now.
Bizzie March 28, 2023 at
I noticed my tick counters are not in sync (ES AND MES). Is this typical or do I need to make some type of adjustments to my chart
Mack March 31, 2023 at
That’s normal. No two tick charts are alike.
Ron March 11, 2025 at
Hi Mack, do you think 950 is still recommended in 2025?
Mack March 12, 2025 at
I would try 1200 +/- a 100 either side. Experiment to find the best match.
Eldan June 18, 2025 at
Hi Mack, given the average size of each candle is like 3-5points on ES 2000 tick chart, how will you adjust your target of 4ticks and SL of 2points from there?
Mack June 30, 2025 at
No, we don’t change anything when the volatility gets higher. Just makes it easier to get the scalp. I might increase my targets on my runners, but I still scalp for 4 ticks.