
How To Find Resting Orders When Trading Price Action
- Home / Non Member Articles (Free) / How To Find Resting Orders When Trading Price Action
One of the keys to becoming a profitable trader is to learn how to find resting orders when trading price action strategies. Knowing where to find large number of resting orders will give you a huge advantage over those traders that do not understand price action and where to find resting orders. Learning how to locate these orders is not as hard as you might think either, and it is the key to learning how to buy low and sell high. When buying low and selling high, if you know where the right types of orders are located, you can determine the areas where you can buy or sell with a very high probability of making a winning trade.
Learning how to find the large accumulations of resting orders is similar to finding strong support and resistance, and these resting orders are why prices normally fail on a break above or below strong support or resistance areas. If you are not familiar with our theory and teachings on how price action reacts around support and resistance areas, then be sure to read this article on support and resistance. Be sure to give this post some time, because it’s important that get a full understanding of what we are teaching here, because this is paramount to learning more about how to read a chart using price action alone.
One of the best ways to find large numbers of resting orders is to first determine where previous support and resistance is located. Take a look at Chart 1 below and notice first and foremost that prices are in a downtrend. The downtrend is clearly evident as prices are making lower highs and lower lows, but you can also clearly see the downward sloping EMA. When prices are in a trend, the idea is to find resistance in downtrend or support in an uptrend. In this case, we have a very clear downtrend.
Notice in Chart 1 that I drew two parallel blue lines, one showing you where support lies and the other showing you where resistance lies. Since this is a strong down trend, we are only interested in resistance, and we will look to enter our trade on pullbacks to resistance areas where there are sure to be a large number of resting sell orders. The weak handed counter trend traders will be placing buy orders at support as well, but we are not interested in buying in a down trend, so we will not look to buy there. Notice the red and blue lines at the high side of resistance. This area between the red and blue lines is where the sell orders will begin to accumulate, so when prices pull back to this area, we will look to go short here, knowing that we have a large amount of selling pressure behind us.

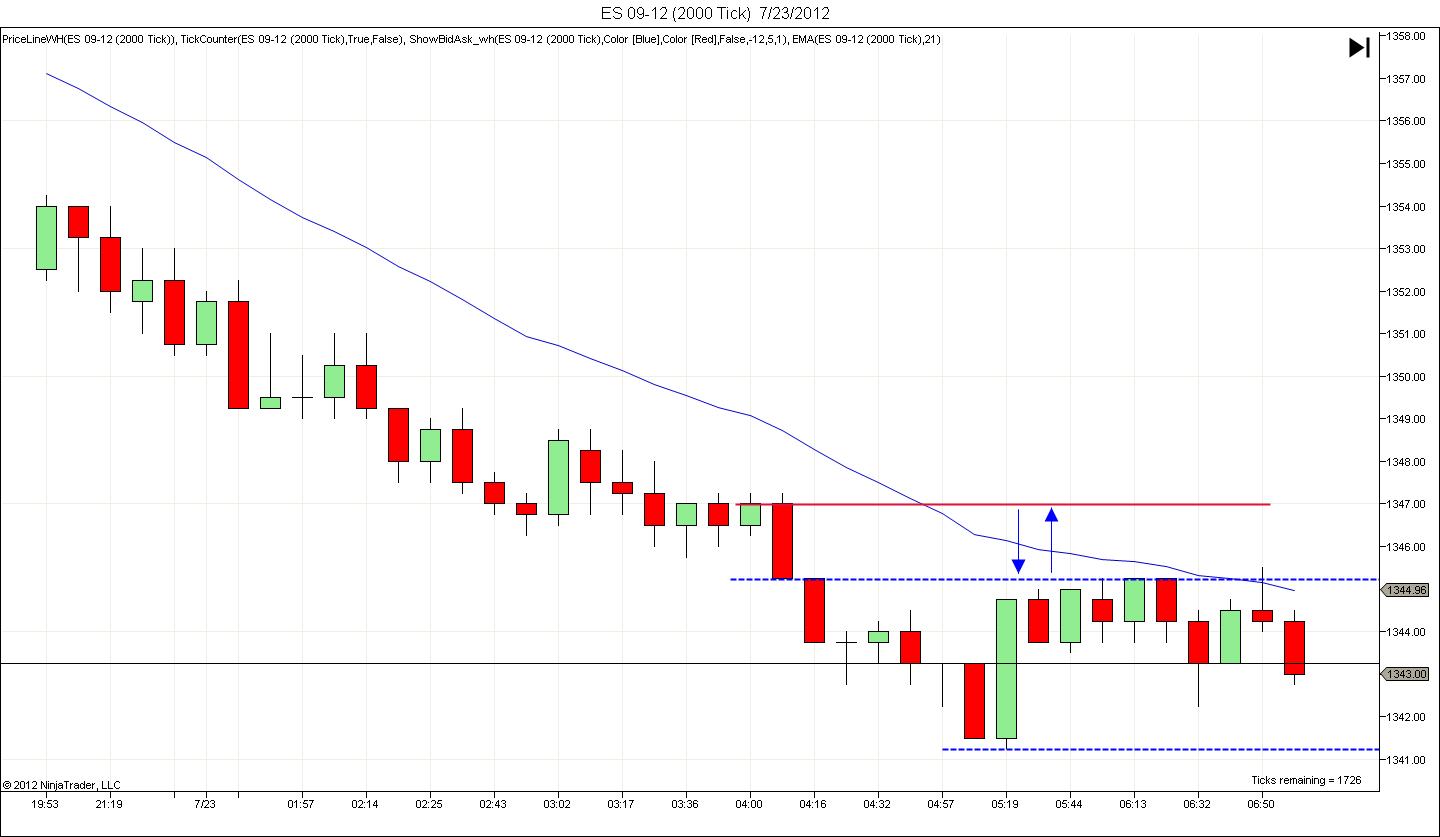
Now look at Chart 2. Prices pulled back and tested the resistance area and broke a single tick higher (noted by the large red arrow), only to hit the resting sell orders and then move quickly lower. Placing a limit sell order just at the previous resistance highs was a great place to get short in this pull back, because we expect the resting sell orders to be there, and we are looking for a reason to enter with the trend as well. By entering here, we not only get a great entry with trend, but we also don’t take even a single tick of heat against our entry position, because it’s all downward action from this point.

Now take a look at what happened with prices in Chart 3. Notice how prices bounced off the support area momentarily before going lower. Why do you think prices bounced there? Prices bounced there because the weak counter trend traders were placing buy orders in advance of prices reaching that point hoping to catch the low of the day. Our theory was correct, there were a lot of resting buy orders, but because the trend was down, there was not enough buying pressure to reverse the market, so the bounce is just that, a temporary bounce due to accumulating buy orders at former support that simply did not hold. This is why we choose to stick with the trend. You can reverse everything we just discussed and use this strategy to buy in an upward trending market.

Now take a look at Chart 4 below. When it comes to a large trading range and when the market is not trending, you can use this strategy to both buy and sell when you reach the areas with the resting orders. Since there is no apparent trend, both the bears and bulls will be active, so resting buy and sell orders will collect on both sides of the range. You will find most of these orders just above the blue support line and most of sell orders just below the blue resistance line. I love to find these large trading ranges that have been tested on both sides multiple times, because they are so predictable. Many weak traders get whipsawed in these ranges and find them very difficult to trade, but if you know and understand where the resting orders are accumulating, then you will learn to sell the highs and buy the lows with ease.

Now notice Chart 4 once again where the circles are drawn. If you have resting buy orders where the blue circles were located, do you think you could have bought there and made money? Notice the red circles, would selling there make you money? The answer is an overwhelming “yes,” and the reason is because so many other traders recognized these areas as areas of strong support and resistance, so they expect prices to reverse each time they reach these areas until the resting orders are eventually worked through or removed, and when this happens, one side will eventually give way and prices will move further.
Hopefully you can now see the importance of learning how to find resting orders when trading price action. If you can learn to read a price chart, while also learning how to spot areas where resting orders are accumulating, then you will also discover how winning traders find it easy to buy low and sell high. You will also quickly find out why winning traders do not counter trend trade as well. If you want to learn how to trade price action like a professional, then you you can find our price action manual at http://priceactiontradingsystem.com/pats-price-action-trading-manual/. Nothing will help your trading more than learning to day trade with price action strategies!
Look at chart three
This site uses Akismet to reduce spam. Learn how your comment data is processed.
Comments
Mary Olsen December 28, 2014 at
Hi Mack, This was an interesting lesson. I see that it was published in 2012.I know that you continue to improve as a price action trader and that as you have honed your skills you have refined your PAT strategy. I think that what I am gleaning from your more recent posts is that you do not use resting orders at an area of S/R but rather you are waiting for a set up to develop at a key area (an area of S/R where you expect resting orders to be) Is this a correct assessment? As always, MAck, thank you so much for what you do. God Bless you and yours.
Mack December 29, 2014 at
The resting orders are what drive the price action at the important sup/res areas. When I say resting orders, I’m not talking about my orders. I’m talking about other peoples orders. Hopefully that was clear, but if not, you might want to read that article a few more times to make sure you get the real ideas about why it is important to understand where the bulk of the orders are residing or “resting.”